
Development of a Drug Early Warning Scoring Model for Cardiac Arrest Using Deep Learning Methods
2 Department of Emergency Medicine, National Taiwan University Hospital, Taipei, Taiwan, Email: hcwang1@gmail.com
3 Department of Pharmacy, National Taiwan University Hospital, Taipei, Taiwan, Email: z10802031@email.ncku.edu.tw
4 School of Pharmacy, College of Medicine, National Taiwan University, Taipei, Taiwan, Email: z10802031@email.ncku.edu.tw
5 Department of Electrical Engineering, National Taiwan University, Taipei, Taiwan, Email: flai@ntu.edu.tw
6 Graduate Institute of Biomedical Electronics and Bioinformatics, National Taiwan University, Taipei, Taiwan, Email: flai@ntu.edu.tw
7 Department of Family Medicine, College of Medicine, National Taiwan University, Taipei, Taiwan, Email: bretthuang@ntu.edu.tw
8 Department of Family Medicine, National Taiwan University Hospital, Taipei, Taiwan, Email: bretthuang@ntu.edu.tw
Received: 07-Jul-2021 Accepted Date: Aug 12, 2021 ; Published: 24-Aug-2021
Citation: Chang H.K, et al. (2021). Development of a Drug Early Warning Scoring Model for Cardiac Arrest Using Deep Learning Methods, EJBI. 17(8): 01-12. DOI: 10.24105/ejbi.2021.17.8.01-12
This open-access article is distributed under the terms of the Creative Commons Attribution Non-Commercial License (CC BY-NC) (http://creativecommons.org/licenses/by-nc/4.0/), which permits reuse, distribution and reproduction of the article, provided that the original work is properly cited and the reuse is restricted to noncommercial purposes. For commercial reuse, contact submissions@ejbi.org
Abstract
Background: In most of Taiwan’s medical institutions, congestion is a serious problem for emergency departments. Due to a lack of hospital beds, patients spend more time in emergency retention zones, which make it difficult to detect cardiac arrest. Objective: We seek to develop a Drug Early Warning Scoring Model (DEWSM), including drug injections and vital signs as these research important features. We use it to predict cardiac arrest in emergency departments via drug classification and medical experts’ suggestion. Methods: We propose this new model for detecting cardiac arrest via drug classification and by using a sliding window, and apply learning-based algorithms to time-series data for a DEWSM. To evaluate the proposed model, we use the area under the receiver operating characteristic curve (AUROC). Results: We identify the two important drug predictors: bits (intravenous therapy), and replenishers and regulators of water and electrolytes (fluid and electrolyte supplement). We verify feature selection, in which accounting for drugs to improve the accuracy and demonstrate that thus accounting for the drugs significantly affects prediction. Also, we show that CPR events can be predicted four hours before the event. Conclusion: Our study used a sliding window to account for dynamic time-series data consisting of the patient’s vital signs and drug injections. The experimental results of adding the drug injections were better than only vital signs. In addition, we using LSTM method as the main processing time series data, it was the bases for comparison of this research.
Keywords
Cardiac arrest; Early warning scoring; Long short-term memory; Time-series; Deep learning
Introduction
The emergency departments in Taiwan’s major medical institutions are often under-resourced and experience significant patient congestion. According to the Ministry of Health and Welfare (MOHW) in Taiwan, the National Taiwan University Hospital (NTUH) is classified as a fourth-level medical center, with 2,000 beds. It averages 300 emergency department (ED) visits per day, of which are 130 stays in ED for more than 6 hours, approximately 13.7% of overall stays for more than 24 hours, 7.7% for more than 48 hours, and 4.6% for more than 72 hours, and averaging 26 hospital admissions per day.
To improve the efficiency and quality of care, various scoring models have been proposed, among which the National Early Warning Score (NEWS), developed by the UK Royal College of Physicians, is the most widespread in emergency department (ED). The NEWS focuses only on the vital signs of patients without consideration of medications used. The NEWS has been also adopted by NTUH since 2005. Smith et al. report a systematic review of various early warning scoring systems for clinical deterioration and only basic vital signs have been used as essential indicators for the scoring model. These systems predict cardiac arrest and death within 48 hours and perform well in a variety of different scoring modes [1-11].
Recently, Matam et al. apply machine learning techniques to develop models for cardiac arrest prediction based on changes of heart rate, respiration rate, systolic blood pressure, and peripheral cutaneous oxygen saturation, constructing a framework with an embedded feature space which uses time series forecasting methods [12]. Jang et al. develop artificial neural network (ANN) classifiers for early detection of patients at risk of cardiac arrest in emergency departments [13]. Churpek et al. propose using data from five hospitals over a five-year period to optimize the predictive value of vital signs by NEWS, compared with the results of different methods using AUROC [14]. Kwon et al. develop and validate a deep learning algorithm to predict the need for critical care in pediatric ED [15]. Most relevant research focus on pediatric intensive care, early warning, and emergency departments, only basic vital signs are used as the main predictive features. Therefore, in this study, we aimed to develop a drug early warning system model to improve the emergency congestion using NEWS as the comparative baseline. The model used drug features as a critical predictor and random forest algorithms in comparison with deep learning-based prognostic algorithms for pediatric emergency department patients (DPED). Furthermore, long short-term memory (LSTM) networks are also utilized since these are well-suited to predictions based on time series data, especially for clinical measurements, in which time series can feature lags of unknown duration and missing values [16], be suitable for the detection of patients with cardiac arrest [17], and can facilitate the early diagnosis of septic shock [18].
1.1 Objectives
In this paper, we focus on cardiac arrest, for which cardiopulmonary resuscitation is used. NEWS is used as our comparative baseline and as an important guideline in the development of an innovative early warning scoring model. Also, we process NTUH electronic medical records using artificial intelligence techniques and develop a new model for cardiac arrest to facilitate prevention and timely intervention in emergency departments. It improves sensitivity and reduces false-positive rates and thereby deaths, correspondingly increasing the quality of medical care and reducing medical costs. The model uses drug features as a critical predictor. The flowchart of this study is shown in Figure 1 (“A” represents the connection points).

Figure 1: Research flowchart (“A” represents the connection points).
Method
Most medical information technology applications make predictions via machine learning. In order to achieve the full effect of precision medicine, electronic medical records should be combined with the use of machine learning and deep learning technology to create a new clinical early warning scoring system to improve prediction accuracy.
In this paper, we used the LSTM algorithm as our main method, because the networks are well-suited to predictions based on time series data, especially for clinical measurements, in which time series can feature lags of unknown duration and missing values. An LSTM cell diagram is shown in Figure 2.

Figure 2: LSTM network cell diagram.
The mathematic formulation of an LSTM network is as follows:
Input gate: 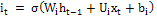 (1)
(1)
Forget gate: 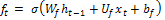 (2)
(2)
Output gate: 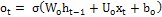 (3)
(3)
Memory cell candidate: 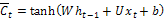 (4)
(4)
Memory cell:  (5)
(5)
Shadow state:  (6)
(6)
Cell output:  (7)
(7)
Our dataset came from Electric Medical Record of NTUH and the record was all de-identification before the data were retrieved from the database (IRB number: 201602011RINB). We propose a new method for the early detection of cardiac arrest which combines drug features and vital signs with a fixed-size sliding window, then applies learning-based algorithms to dynamic time-series data. This method involves the following processing steps:
1. Clinical data are usually very noisy, with a high percentage of missing values and outliers. Furthermore, patients receiving cardiopulmonary resuscitation (CPR) were minorities resulting in imbalanced data. Thus, we performed data cleaning firstly which included missing value imputation, outlier removal, and data resampling to account for data imbalance problem.
2. Whereas ED retention of patients typically resulted in a considerable volume of time-series data, for example, medical treatment/events such as vital sign measurements and drug injection happen sporadically and almost irregularly for each patient before the CPR event. In order to maintain the consistency of the observation time, we used a fixed 2-hour sliding window.
3. Finally, we use feature selection (FS) on drug classes, with which we expect to see the influence of drugs.
2.1.Data Preprocessing: Missing Data Imputation, Outlier Removal, and Data Resampling
For various reasons, medical records were usually incomplete, with considerable incorrect information. Therefore, preprocessing was needed before the data could be used for machine learning based modeling. Here are the steps we took for preprocessing.
1. Outlier removal: Abnormal values of various vital signs were detected simply by means of domain knowledge. For example, the blood pressure value should not be higher than 300, the respiratory rate should be between 10 and 30, the pulse rate should be less than 300, and the body temperature should be between 28 and 42. Data entries with abnormal values were deleted from the dataset.
2. Missing value imputation: If any vital sign was missing, we replaced it with the mean value. If the time for a vital sign measurement or a drug injection was missing, we replaced it with the previous time for such treatment plus 30 minutes, as suggested by a senior physician in the ED. We also used the Multivariate Imputation by Chained Equations (MICE), which was a multiple imputation method used to replace missing data values in a data set. Under certain assumptions in the ED, the missing values of our data would be replaced by common clinical judgments provided by physicians.
3. Due to its unpredictability, patients who received CPR within one hour of arrival were deleted from the dataset. After the above preprocessing steps, there remained in the dataset 124 CPR patients and 43,445 non-CPR patients. Moreover, we deleted duplicate records and records without vital sign measurements, leaving 33,273 non-CPR patients and 108 CPR patients for further processing.
4. Chang et al. use under-sampling to reduce the amount of imbalanced data to facilitate various kinds of analysis [19]. In contrast, most medical research is based on over-sampling which may enlarge the dataset. Liu et al. use re-sampling to balance the data and increase prediction accuracy [20]. In this study, we adopted a compromise to keep the dataset to a medium size by both under- and over-sampling. For under-sampling, we used stratified random subsampling [21]. For over-sampling, we used Borderline-SMOTE [22]. We used 3-fold cross-validation to objectively estimate the accuracy of the identified model. This study used the k-fold cross-validation (k=3). It divided the training set into k sub-samples, and a single sub-sample was retained as the data for the verification model. The other k−1 samples were used for training. Cross-validation is repeated k times, each sub subsample was verified once, the results of k times were averaged or other combinations were used, then a single estimate was finally obtained. The adopted re-sampling schemes were used for training data only during cross-validation, resulting in a total of 9,270 CPR patients and 9,270 non-CPR patients for training. The flowchart for imbalanced data processing was shown in Figure 3. (“A” represents the connection points) [23].

Figure 3: Flowchart for imbalanced data processing (“A” represents the connection points).
2.2. Dynamic data as Time-series data
Our dataset contained both static and dynamic features, as shown in Table 1. The static features were the results of onetime measurement, and the dynamic features were the results of cycle measurement in our research database. In this study, as we focused on exploring the effects of drug usage on vital signs, we used only dynamic features for subsequent analysis. The dataset included adult patients who visited the ED and stayed for more than 6 hours from 2014 to 2015.
| Types | Features |
|---|---|
| Static | Age, gender, height, weight, fever, Glasgow Coma Scale (GCS), triage, acute change, discharge status |
| Dynamic | Systolic blood pressure, diastolic blood pressure, pulse, respiratory rate, body temperature, SpO2, medication information |
Table 1. Static and dynamic features
According to the official ED medical treatment procedure of NTUH, in general, drug injections were given at a fixed time interval of 6 hours and vital signs were measured at a fixed time interval of 8 hours, as shown in Figure 4. For a fair comparison with NEWS, we used the same physiological parameters as NEWS for our experiments, including pulse, body temperature, systolic blood pressure, SpO2, and respiratory rate. Moreover, we took drug injection information into account, and attempted to find the most influential drug type to build the prediction model.

Figure 4: Time intervals for vital sign measurements and drug injections.
2.3. Feature extraction from observation intervals
We proposed using four non-overlapping sliding windows of 2 hours each to extract features for model training. These 8 hours were referred to as the observation interval. In practice, we extracted features (including vital signs and drug usage counts) from each 2-hour sub-interval and then concatenated these features to obtain a single feature vector for the 8-hour observation interval. For different patients, we had different ways of placing the observation interval, as explained below.
I. CPR patients
a. During CPR event
For CPR patients, we could place the observation interval with a given lead time. In other words, if the model worked well, we should be able to predict the CPR event in advance with the lead time. The longer the lead time, the more difficult the prediction, for comparison, we used a lead time of 0 and 4 hours, as shown in the following figure. The start time from the CPR event was as the observational time; the total duration was 8 hours. The size of the time-series sliding window was 2 hours. Each window had vital sign values and drug count values. The observational diagram of the CPR event without overlapping was shown in Figure 5. The new method involved the two steps above. In general, 8 hours corresponded to the shifts of the nursing staff, and 6 hours was the drug dosing interval. We chose 8 hours as an observational window and 2 hours as a sliding window without overlapping.

Figure 5: CPR event without overlap.
b. Before CPR event
To be earlier than the average 3.5 hours in the literature, the observational times were set to 4 hours before the CPR event. The total duration was 8 hours, including drug counts and the mean value of vital signs. The size of the time-series sliding window was 2 hours. There were 4 hours before the CPR event without overlapping. The observational diagram is shown in Figure 6.

Figure 6: Four hours before CPR event without overlap.
II. Non-CPR patients
For the observational time of non-CPR patients, we used the first vital sign measurement time plus the average CPR time as the starting time. The total duration was 8 hours, and the average CPR time was 30 hours. The non-CPR patients without overlap were shown in Figure 7.

Figure 7: Non-CPR patients without overlap.
2.4. Drug Feature Extraction
According to the National Taiwan University Hospital Pharmacy Formula (NTUHPF), the original pharmaceutical health record (PHR) had 1,038 unique drug codes. In our dataset, for each unique drug code, the minimum usage count was 1, and the maximum usage count was 78,103. If we were to directly use these drug codes to derive our drug features, the features would be too sparse. Thus, we asked medical experts to divide the original drug codes into 93 meaningful categories based on their expert knowledge.
Among the original features, the best partial features were selected to achieve the highest recognition rate. Features with better discriminative ability simplify the calculation of the classifier and facilitate the learning of causal relationships. As such, we used heuristic methods such as the sequential forward selection (SFS) proposed by Whitney (23). It involved the following steps:
1. Use RF as the classifier, and the leave-one-out test for recognition rate estimate.
2. Select the first feature that has the highest leave-one-out (LOO) recognition rate among all features.
3. Select the feature, among all unselected features, together with the selected features that gives the highest recognition rate.
4. Repeat the previous process until you have selected enough number of features, or until the recognition rate is good enough.
The best results were the following nine categories: penicillin, mucolytic agents, diuretics, drugs used in asthma, cephalosporins, digestants, hypoglycemic agents, replenishers and regulators of water and electrolytes, and agents used in peptic ulcers. These nine features were selected by the use of the SFS, the random forest (RF) classifier, and 3-fold cross-validation. The process of selecting drug features was shown in Figure 8.

Figure 8: Drug feature selection process.
Experimental Setup
The dataset for this cohort study was collected from adult patients (minimum 20 years of age) who visited the NTUH ED from 2014 to 2015. These patients stayed in the ED for more than 6 hours and were non-trauma patients, excluding do-Not-Resuscitate (DNR). The two experimental tasks were as follows:
• Task Definition
We conducted two experiments for the following reasons:
1. The first task was using the emergency doctor’s clinical rule-based experience: that there were four drugs that can affect the patient’s vital signs and result in cardiac arrest.
2. The second task was based on the classification of drug prescriptions in NTUH and according to the detailed classifications of the director of the pharmacy department; the ML/DL algorithms were used to automatically select features and find the most influential drug features.
Below we present descriptions and definitions of the experimental tasks.
a. Emergency Medical Expert’s Drug Advice
In Task 1 we asked emergency medical experts about drugs. They identified four common categories (bits, painkillers, antibiotics, and diuretics) that could affect patient vital signs in emergency medications. The nine learning-based algorithms and the timeseries sliding window without overlapping were combined in this task. The vital signs could be compared during and before the CPR event.
b. Drug Classification
Feature selection was used to classify the drug categories in the pharmaceutical health record (PHR) in Task 2. The best results were nine categories: penicillin, mucolytic agents, diuretics, drugs used in asthma, cephalosporins, digestants, hypoglycemic agents, replenishers and regulators of water, electrolytes, and agents used in peptic ulcers. In this task, nine learning-based algorithms were combined with the time-series sliding window without overlapping to train the model. For earlier predictions, we compared the results during the CPR event and before the CPR event.
Results
Figure 9 shows the Area under Curve of the Receiver Operating Characteristic (AUROC) bar chart with the expert advice about drugs. Vital signs, bits, painkillers, antibiotics, and diuretics are included in the chart. In Figure 9, (1) represents the CPR event; (2) represents four hours before the CPR event, which means four hours before the CPR event as the starting observational time; the total durational time is eight hours. Two hours is the size of the time-series window. The purpose is to verify if the prediction is earlier than the average of 3.5 hours in the literature.

Figure 9: Medical expert advice: Area under Curve of the Receiver Operating Characteristic (AUROC).
For the comparison with NEWS, five vital signs and four drug categories were used to train the model. In the literature, as the best rule-based model for medicine is the random forest, we compare the prediction accuracy of random forests with that of deep learning techniques such as CNN, LSTM, and other hybrid models. In this study, the LSTM model is used as the primary observational model.
I. Task 1
a. During CPR Event
In the RF model, the AUROC of vital signs is 77%; the AUROC of all categories is 86%. Adding drug features increases the accuracy and forecast rate. It has a significant impact on the vital signs of the patients. In the LSTM model, the AUROC of vital signs is 66%, and that of all categories is 76%. Comparing the two models, RF is better than LSTM model.
b. Before CPR Event
In the RF model, the AUROC of vital signs is 68%, and that of all categories is 73%. Adding the drug categories still yields a better accuracy than that with NEWS. Although the AUROC accuracy is less than that of the CPR event, the predictive accuracy approaches 70%.
In the LSTM model, the AUROC of vital signs is 62%, and that of all categories is 64%. Although the LSTM accuracy is not better than that of the RF model, adding drug categories still improves predictive accuracy before the CPR event or during the CPR event.
According to the drug features proposed by Dr. Wang, Figure 10 shows the vital signs after adding the bits drug category: this yields the best predictive accuracy and is the most influential of all drug features. Figures 10 (a) and (b) show the AUROC of bits during and before the CPR event. The training model’s numerical AUROC value is shown in Table 2.

Figure 10: Medical expert advice: Area under Curve of the Receiver Operating Characteristic (AUROC) for bits (a) during CPR event and (b) before CPR event.
| Methods | VS | VS+Bits | VS+Painkiller | VS+Diuretic | VS+Antibiotic | All | ||||||
|---|---|---|---|---|---|---|---|---|---|---|---|---|
| CPR event | 2 | 1 | 2 | 1 | 2 | 1 | 2 | 1 | 2 | 1 | 2 | 1 |
| LR | 0.69 | 0.73 | 0.66 | 0.71 | 0.67 | 0.71 | 0.67 | 0.71 | 0.66 | 0.71 | 0.66 | 0.71 |
| RF | 0.68 | 0.77 | 0.71 | 0.85 | 0.68 | 0.76 | 0.69 | 0.74 | 0.66 | 0.75 | 0.73 | 0.86 |
| NB | 0.69 | 0.74 | 0.69 | 0.80 | 0.64 | 0.66 | 0.61 | 0.71 | 0.67 | 0.73 | 0.59 | 0.73 |
| C 4.5 | 0.58 | 0.70 | 0.62 | 0.79 | 0.64 | 0.70 | 0.63 | 0.64 | 0.62 | 0.67 | 0.63 | 0.80 |
| CART | 0.66 | 0.64 | 0.65 | 0.62 | 0.67 | 0.61 | 0.67 | 0.61 | 0.64 | 0.61 | 0.65 | 0.62 |
| AdaBoost | 0.60 | 0.56 | 0.58 | 0.70 | 0.53 | 0.48 | 0.54 | 0.47 | 0.53 | 0.50 | 0.52 | 0.61 |
| CNN | 0.59 | 0.67 | 0.63 | 0.67 | 0.67 | 0.63 | 0.66 | 0.63 | 0.62 | 0.62 | 0.62 | 0.62 |
| LSTM | 0.62 | 0.66 | 0.65 | 0.76 | 0.68 | 0.70 | 0.68 | 0.71 | 0.65 | 0.70 | 0.64 | 0.76 |
| CNN+LSTM | 0.61 | 0.66 | 0.63 | 0.66 | 0.65 | 0.65 | 0.66 | 0.66 | 0.65 | 0.66 | 0.64 | 0.68 |
Table 2. Expert advice: Area Under Curve of the Receiver Operating Characteristic (AUROC)
Figure 11 shows the AUROC bar chart by the drug classification; it includes vital signs, replenishers and regulators of water, electrolytes, digestants, drugs used in asthma, diuretics, penicillin, agents used in peptic ulcers, hypoglycemic agents, mucolytic agents, and cephalosporins. (1) Represents the CPR event; (2) represents four hours before the CPR event, which means four hours before the CPR event as the starting observational time; the total duration is eight hours. Two hours is as the size of the time-series window.

Figure 11: Area under Curve of the Receiver Operating Characteristic (AUROC) by drug classification.
The RF model is the best model in the literature for predicting cardiac arrest, and LSTM models time-series data well. Therefore, in this task, deep learning techniques are still compared with traditional machine learning techniques; a total of nine different models were trained. The model was trained by five vital signs and nine drug features. We used the same technical comparison as in Task 1 to learn whether more detailed drug classifications reveal the most important predictors.
II. Task 2
a. During CPR Event
In the RF model, the AUROC of vital signs is 77%; the AUROC of all features is 85%. In the LSTM model, the AUROC of vital signs is 66%, and that of all features is 85%. Comparing both models, LSTM with the vital signs, drug features, and time series is more accurate than RF. The replenishers and regulators of water and electrolytes are the most influential drug features in all classes.
b. Before CPR Event
In the RF model, the AUROC of vital signs is 68%; that of all features is 78%. For LSTM, the AUROC of vital signs is 62%, and that of all features is 66%. Before the CPR event, adding drug features still improves accuracy, performing far better than NEWS. RF accuracy is best in this case, with a prediction accuracy of about 70%.
However, in LSTM, the prediction accuracy is only 66%. The inability to improve the prediction accuracy may be due to the difference between the dosage forms and the dosages of various drugs. Figure 11 shows that replenishers and regulators of water and electrolytes is still the better drug feature; the replenishers and regulators of water and electrolytes and bits suggested by Dr. Wang are determined to be the same feature.
Figures 12 (a) and (b) show the AUROC of replenishers and regulators of water and electrolytes during and before the CPR event. The model’s numerical AUROC values are shown in Tables 3 and 4.

Figure 12: Area under Curve of the Receiver Operating Characteristic (AUROC) by drug classification for replenishers & regulators of water & electrolytes (a) during CPR event and (b) before CPR event
| Methods | VS | VS+D6 | VS+D8 | VS+D13 | VS+D19 | VS+D27 | ||||||
|---|---|---|---|---|---|---|---|---|---|---|---|---|
| CPR event | 2 | 1 | 2 | 1 | 2 | 1 | 2 | 1 | 2 | 1 | 2 | 1 |
| LR | 0.69 | 0.73 | 0.69 | 0.73 | 0.69 | 0.73 | 0.69 | 0.73 | 0.69 | 0.73 | 0.69 | 0.73 |
| RF | 0.68 | 0.77 | 0.76 | 0.86 | 0.70 | 0.78 | 0.69 | 0.77 | 0.72 | 0.77 | 0.70 | 0.79 |
| NB | 0.69 | 0.74 | 0.69 | 0.83 | 0.65 | 0.69 | 0.67 | 0.68 | 0.62 | 0.73 | 0.63 | 0.71 |
| C 4.5 | 0.58 | 0.70 | 0.65 | 0.76 | 0.58 | 0.69 | 0.61 | 0.67 | 0.63 | 0.70 | 0.60 | 0.68 |
| CART | 0.66 | 0.64 | 0.66 | 0.76 | 0.66 | 0.64 | 0.66 | 0.64 | 0.66 | 0.64 | 0.66 | 0.64 |
| AdaBoost | 0.60 | 0.56 | 0.60 | 0.70 | 0.58 | 0.51 | 0.58 | 0.52 | 0.58 | 0.52 | 0.54 | 0.59 |
| CNN | 0.59 | 0.67 | 0.61 | 0.76 | 0.61 | 0.70 | 0.61 | 0.74 | 0.61 | 0.74 | 0.63 | 0.73 |
| LSTM | 0.62 | 0.66 | 0.64 | 0.83 | 0.64 | 0.76 | 0.64 | 0.77 | 0.64 | 0.76 | 0.64 | 0.76 |
| CNN+LSTM | 0.61 | 0.66 | 0.65 | 0.77 | 0.63 | 0.74 | 0.63 | 0.73 | 0.64 | 0.73 | 0.64 | 0.74 |
Table 3. Drug Classification: Area Under Curve of the Receiver Operating Characteristic (AUROC)
| Methods | VS+D29 | VS+D33 | VS+D34 | VS+D73 | All | ||||||
|---|---|---|---|---|---|---|---|---|---|---|---|
| CPR Event | 2 | 1 | 2 | 1 | 2 | 1 | 2 | 1 | 2 | 1 | |
| LR | 0.69 | 0.73 | 0.69 | 0.73 | 0.69 | 0.73 | 0.69 | 0.73 | 0.69 | 0.73 | |
| RF | 0.72 | 0.77 | 0.71 | 0.79 | 0.69 | 0.78 | 0.70 | 0.78 | 0.78 | 0.85 | |
| NB | 0.67 | 0.73 | 0.64 | 0.72 | 0.62 | 0.70 | 0.68 | 0.75 | 0.47 | 0.62 | |
| C 4.5 | 0.63 | 0.68 | 0.60 | 0.68 | 0.59 | 0.68 | 0.58 | 0.69 | 0.58 | 0.75 | |
| CART | 0.66 | 0.64 | 0.66 | 0.64 | 0.66 | 0.64 | 0.66 | 0.64 | 0.66 | 0.76 | |
| AdaBoost | 0.57 | 0.55 | 0.58 | 0.57 | 0.58 | 0.54 | 0.57 | 0.55 | 0.53 | 0.67 | |
| CNN | 0.61 | 0.69 | 0.61 | 0.72 | 0.61 | 0.72 | 0.60 | 0.74 | 0.61 | 0.62 | |
| LSTM | 0.64 | 0.76 | 0.64 | 0.77 | 0.64 | 0.76 | 0.64 | 0.77 | 0.66 | 0.85 | |
| CNN+LSTM | 0.63 | 0.73 | 0.63 | 0.72 | 0.62 | 0.73 | 0.64 | 0.72 | 0.63 | 0.73 | |
Table 4. Drug Classification: Area Under Curve of the Receiver Operating Characteristic (AUROC)
Discussion and Conclusion
In the current study, we compared the proposed approach using the two important drug predictors additionally with the traditional NEWS using vital signs only, and we found improvement of prediction accuracy from 77% to 85% (random forest), and from 66% to 85% (LSTM). We verify feature selection, in which accounting for drugs to improve the accuracy and demonstrate that thus accounting for the drugs significantly affects prediction. We also showed that CPR events could be predicted four hours in advance.
Due to the rough classification and incomplete nature of the four drug categories provided by the emergency physicians, and according to the pharmacists’ classifications of NTUH drug prescriptions, we collected more complete drug classification information to predict cardiac arrest. We found that the three features follow the rules suggested by emergency physicians: diuretics, replenishers and regulators of water and electrolytes, and antibiotics. We found the most important drug predictors to be bits and replenishers and regulators of water and electrolytes. Note that abnormal amounts of potassium and calcium ions were indeed significantly associated with cardiac arrest.
In the current study, we used traditional machine learning and deep learning methods to address the dynamic time-series nature of patients’ vital signs and drug injections. We also use resampling to account for imbalanced data. After drug classification based on the initial classification of the pharmacist and feature selection, we added the nine drug categories in our model, improving prediction accuracy by random forest and LSTM. We found a better model (LSTM) for predicting cardiac arrest, which seemed to have better prediction power than previous studies [1-11]. From 2010 to 2014, there are different types of Early Warning Score (EWS). For example, Rothschild et al. use single items but not combine to build a scoring system [2]. In the Modified Early Warning Score (MEWS), some scholars use 6-item 7-item, and 12-item respectively as the indicator features for the development of MEWS [3,5-6,10]. VitalpacTM Early Warning Score (ViEWS) has been developed based on 6 and 7-item by some scholars [4,8- 9]. Smith et al. proposed 7-item of National Early Warning Score (NEWS) [7], and Churpek et al. proposed 16-item of EWS [11]. No matter how many items in scoring system, they combine different items to the EWS model, including the vital signs information in scoring system. The parameters commonly used in scoring system are heart rate, respiratory rate; systolic blood pressure, temperature and oxygen saturation, but this parameter does not include drug features.
The biggest difference between this research and the previous research is that we have added drug features as the main axis of the research model in the use of parameters. Due to adding drug features, the prediction rate of NEWS model that better than only used vital signs has increased. Our study is the first to use drug features as predictive factors for cardiac arrest.
Furthermore, we attempted earlier predictions, achieving an accuracy of 70%, and doing so four hours before the CPR event. We expected that our results may be applied to reduce congestion in the emergency department and facilitate more timely medical treatment in the future.
Our study has some limitations. The key to the research described here was acquiring more data. As we here use only two years’ of NTUH data, our results may not be applied in other hospitals. Due to severe data imbalance, we achieved a predicted accuracy less than 90%. However, in this study, we proposed a drug early warning system model with drug features combining drug classification with dynamic time-series analysis that have a specific influence. We also proposed that using a non-overlapping sliding observational window during model training to reduce overfitting and shortages in training data were mitigated via a reasonable sliding window with fixed length without overlapping. Moreover, taking four hours before the CPR event as the starting time of prediction, we compared it with the predicted start time when the CPR event occurs. Even if the observational time was advanced, it still helped prediction, which exceeded the average of 3.5 hours. Our experiment results did show that drug injections have a significant impact.
In future work, we expect to conduct the following studies: (1) using the Anatomical Therapeutic Chemical Classification System (ATCCS) for more details about drug dosage units in all drug categories, (2) using signal processing techniques with vital signs to calculate and modify the LSTM model, (3) developing a set of dashboards (containing drug information) for use in emergency medicine, and providing a complete decision support system for hospitals.
Conflicts of Interest
None declared.
Authors Contributions
HC conceptualized and designed the drug early warning system model, provided the complete research framework and innovative ideas, and finished the writing of the final draft. HW is the data provider. CH interpreted the drug data and particularity and assisted with drug classification. KH & FL guided the research architecture and critically revised the manuscript.
All authors helped to critically review and revise the manuscript and approved the final version.
Acknowledgements
This work was supported in part by the Ministry of Science and Technology, Taiwan, under grant number MOST 107-2634-F- 002-015.
REFERENCES
- Smith MEB, Chiovaro JC, O’Neil M, Kansagara D, Quiñones AR, Freeman M, et al. Early Warning System Scores for Clinical Deterioration in Hospitalized Patients: A Systematic Review. Ann Am Thorac Soc. 2014;11(9):1454–65.
- Rothschild JM, Gandara E, Woolf S, Williams DH, Bates DW. Single-Parameter Early Warning Criteria to Predict Life-Threatening Adverse Events. J Patient Saf. 2010;6(2):97–101.
- Meester KD, Das T, Hellemans K, Verbrugghe W, Jorens PG, Verpooten GA, et al. Impact of a standardized nurse observation protocol including MEWS after Intensive Care Unit discharge. Resuscitation. 2013;84(2):184–8.
- Kellett J, Kim A. Validation of an abbreviated VitalpacTM Early Warning Score (ViEWS) in 75,419 consecutive admissions to a Canadian Regional Hospital. Resuscitation. 2012;83(3):297–302.
- Mitchell IA, McKay H, Leuvan CV, Berry R, McCutcheon C, Avard B, et al. A prospective controlled trial of the effect of a multi-faceted intervention on early recognition and intervention in deteriorating hospital patients. Resuscitation. 2010;81(6):658–66.
- Moon A, Cosgrove JF, Lea D, Fairs A, Cressey DM. An eight year audit before and after the introduction of modified early warning score (MEWS) charts, of patients admitted to a tertiary referral intensive care unit after CPR. Resuscitation. 2011;82(2):150–4.
- Smith GB, Prytherch DR, Meredith P, Schmidt PE, Featherstone PI. The ability of the National Early Warning Score (NEWS) to discriminate patients at risk of early cardiac arrest, unanticipated intensive care unit admission, and death. Resuscitation. 2013;84(4):465–70.
- Opio MO, Nansubuga G, Kellett J. Validation of the VitalPACTM Early Warning Score (ViEWS) in acutely ill medical patients attending a resource-poor hospital in sub-Saharan Africa. Resuscitation. 2013;84(6):743–6.
- Prytherch DR, Smith GB, Schmidt PE, Featherstone PI. ViEWS—Towards a national early warning score for detecting adult inpatient deterioration. Resuscitation. 2010;81(8):932–7.
- Albert BL, Huesman L. Development of a Modified Early Warning Score Using the Electronic Medical Record. Dimensions Critical Care Nurs. 2011;30(5):283–92.
- Churpek MM, Yuen TC, Park SY, Gibbons R, Edelson DP. Using Electronic Health Record Data to Develop and Validate a Prediction Model for Adverse Outcomes in the Wards* Crit Care Med. 2014;42(4):841–8.
- Matam BR, Duncan H, Lowe D. Machine learning based framework to predict cardiac arrests in a paediatric intensive care unit. J Clin Monitor Comp. 2019;33(4):713–24.
- Jang D-H, Kim J, Jo YH, Lee JH, Hwang JE, Park SM, et al. Developing neural network models for early detection of cardiac arrest in emergency department. Am J Emerg Medicine. 2019;(Ann Emerg Med 61 2013).
- Churpek MM, Adhikari R, Edelson DP. The value of vital sign trends for detecting clinical deterioration on the wards. Resuscitation. 2016;102(Am J Respir Crit Care Med 190 2014):1–5.
- Kwon J, Jeon K, Lee M, Kim K, Park J, Oh B. Deep Learning Algorithm to Predict Need for Critical Care in Pediatric Emergency Departments. Pediatr Emerg Care. 2019;1.
- Lin Y-W, Zhou Y, Faghri F, Shaw MJ, Campbell RH. Analysis and prediction of unplanned intensive care unit readmission using recurrent neural networks with long short-term memory. Plos One. 2019;14(7): e0218942.
- Kwon J, Lee Y, Lee YLS, Park J. An Algorithm Based on Deep Learning for Predicting In-Hospital Cardiac Arrest. Journal of the American Heart Association. 2018.
- Lin C, Zhang Y, Ivy J, Capan M, Arnold R, Huddleston JM, et al. Early Diagnosis and Prediction of Sepsis Shock by Combining Static and Dynamic Information Using Convolutional-LSTM. 2018 IEEE Int Conf Healthc Informatics ICHI. 2018;219–28.
- Chang H-K, Wu C-T, Liu J-H, Lim WS, Wang H-C, Chiu S-I, et al. Early Detecting In-Hospital Cardiac Arrest Based on Machine Learning on Imbalanced Data. 2019 IEEE International Conference on Healthcare Informatics. 2019.
- Liu J-H, Chang H-K, Wu C-T, Lim WS, Wang H-C, Jang J-SR. Machine Learning Based Early Detection System of Cardiac Arrest. 2019 Conference on Technologies and Applications of Artificial Intelligence (TAAI). 2019;1–6.
- Aoyama H. A Study of the Stratified Random Sampling. Annals of the Institute of Statistical Mathematics. 1954;1–38.
- Han H, Wang W-Y, Mao B-H. Advances in Intelligent Computing, International Conference on Intelligent Computing, ICIC 2005, Hefei, China, August 23-26, 2005, Proceedings, Part I. International Conference on Intelligent Computing. 2005;878–87.
- Whitney AW. A Direct Method of Nonparametric Measurement Selection. Ieee T Comput. 1971;C–20(9):1100–3.