
Assessment of contextualised representations in detecting outcome phrases in clinical trials.
2 Department of Health Data Science, The University of Liverpool, Liverpoo1, UK
Received: 01-Sep-2021 Accepted Date: Sep 22, 2021 ; Published: 30-Sep-2021, DOI: 10.24105/ejbi.2021.17.9.53-65
Citation: Abaho M, Bollegala D, Williamson P and Dodd S (2021). Assessment of contextualised representations in detecting outcome phrases in clinical trials. EJBI. 17(9): 53-65.
This open-access article is distributed under the terms of the Creative Commons Attribution Non-Commercial License (CC BY-NC) (http://creativecommons.org/licenses/by-nc/4.0/), which permits reuse, distribution and reproduction of the article, provided that the original work is properly cited and the reuse is restricted to noncommercial purposes. For commercial reuse, contact submissions@ejbi.org
Abstract
Background: Automating the recognition of out- comes reported in clinical trials using machine learning has a huge potential of speeding up access to evidence necessary in healthcare decision making. Prior research has however acknowledged inadequate training corpora as a challenge for the Outcome detection (OD) task. Additionally, several contextualised representations (embeddings) like BERT and ELMO have achieved unparalleled success in detecting various diseases, genes, proteins and chemicals, however, the same cannot be emphatically stated for outcomes, because these representation models have been relatively undertested and studied for the OD task.
Methods: We introduce “EBM-COMET”, a dataset in which 300 Randomised Clinical Trial (RCT) PubMed abstracts are expertly annotated for clinical outcomes. Unlike prior related datasets that use arbitrary outcome classifications, we use labels from a taxonomy recently published to standardise outcome classifications. To extract outcomes, we fine-tune a variety of pretrained contextualised representations, additionally; we use frozen contextualised and context-independent representations in our custom neural model augmented with clinically informed Part-Of-Speech embeddings and a cost- sensitive loss function. We adopt strict evaluation for the trained models by rewarding them for correctly identifying full outcome phrases rather than words within the entities i.e. given an outcome phrase “systolic blood pressure”, the models are re- warded a classification score only when they predict all 3 words in sequence, otherwise they are not rewarded.
Results and Conclusion: We observe our best model (BioBERT) achieve 81.5% F1, 81.3% sensitivity and 98.0% specificity. We reach a consensus on which contextualised representations are best suited for detecting outcome phrases from clinical trial abstracts. Furthermore, our best model out performs scores published on the original EBM-NLP dataset leaderboard scores.
References
Blog | Yacht Charter in Greece Best Betting Sites in Indonesia Blog | Yacht Charter in Croatia Find Lawyer in Connecticut Blog | Yacht Charter in Italy Find Lawyer in Maryland Blog | Yacht Charter in Japan Info Blockchain Technologies Blog | Yacht Charter in Philippines Obgyn Journals Blog | Yacht Charter in Saudi Arabia Education Technologies Articles Blog | Yacht Charter in Turkey Cooling Technologies Articles Blog | Yacht Charter in UK Find Lawyer in New York Blog | Yacht Charter in USA Web Technologies Articles Blog | Places to Visit in Australia Best Betting Sites in VenezuelaKeywords
Abaho M, Bollegala D, Williamson P and Dodd S (2021). Assessment of contextualised representations in detecting outcome phrases in clinical trials. EJBI. 17(9): 53-65.
Introduction
There is growing recognition of the potential benefits of using readily available sources of clinical information to support clinical research [1] of particular importance is the identification of information about outcomes measured on pa- tients, for example, blood pressure, fatigue, etc. The ability to automatically detect outcome phrases contained within clinical narrative text will serve to maximize the potential of such sources. For example, hospital or GP letters, or free text fields recorded within electronic health records, may contain valuable clinical information which is not readily accessible or analysable without manual or automated extraction of relevant outcome phrases. Similarly, automated identification of outcomes mentioned in trial registry entries or trial publications could help to facilitate systematic review processes by speeding up outcome data extraction. Furthermore, the benefits of automated outcome recognition will be increased further if it extends to categorisation of outcomes within a relevant classification system such as taxonomy proposed in [2]. The potential contribution of Natural Language Processing (NLP) to EBM [3] has been limited by the scarcity of publicly available annotated corpora [4] and the inconsistency in how outcomes are described in different trials [2, 5, 6]. Nonetheless, rapid advancement in NLP techniques has accelerated NLP-powered EBM research, enabling tasks such as detect- ing elements that collectively form the basis of clinical questions including Participants/population (P), Interventions (I), Comparators (C), and Outcomes (O) [7]. I and C are often collapsed into just I [4, 8, 9].
EBM-NLP corpus [4] is the only publicly available corpus that can support individual outcome phrase detection. How- ever, this dataset used an arbitrary selection of outcome classifications despite being aligned to Medical Subject Headings (MESH) 1. Moreover, it contains flawed outcome annotations [10] such as measurement tools and statistical metrics incorrectly annotated as outcomes and others which we men- tion in section 2.7.
In this work, we are motivated by the outcome taxonomy recently built and published to standardise outcome classifications [2]. We work closely with experts to annotate out- comes with classification drawn from this taxonomy. Several variations of state-of-the-art (SOTA) CLMs that include BioBERT [11], SciBERT [12], Clinical BERT [13] and others have recently emerged to aid clinical NLP tasks. De- spite their outstanding performance in multiple clinical NLP tasks such as BNER [14, 15] and relation extraction [16], they have been underutilised for the outcome detection task, mainly because of inadequate corpora [4]. Given that, clinical trial abstracts (which report outcomes) are part of the medical text on which these CLMs are pre-trained, we leverage transfer learning (TL) and make full use of them to achieve individual outcome detection. The goal in the outcome detection task is to extract outcome phrases from clinical text. For example, in a sentence, “Among patients who received sorafenib, the most frequently reported adverse events, were grade 1 or 2 events of rash (73%), fatigue 67%, hypertension (55%) and diarrhea (51%)”, we extract all outcome phrases such as those underlined and in bold font. This enables those searching the literature including patients and policymakers to identify research that addresses the health out- comes of most importance to them [17]. Following previous studies that investigated which embeddings are best suited for clinical-NLP text classification tasks [18], we focus this work on probing for some consensus amongst various SOTA domain-specific CLM embeddings, determining which embeddings are best suited for outcome detection. A summary of our contributions includes,
1. We introduce a novel outcome dataset, EBM-COMET, in which outcomes within randomised clinical trial (RCT) abstracts are expertly annotated with outcome classifications drawn from [2].
2. We assess the performance of domain-specific (clinical) context-dependent representations in comparison to generic context-dependent and context-independent representations for the outcome detection task.
3. We assess the quality in detecting full mention of outcome phrases in comparison to detection of individual words contained in outcome phrases. Ideally, given an outcome phrase “systolic blood pressure”, full outcome phrase evaluation strictly rewards models for correctly detecting all 3 words in that sequence, whereas word- level evaluation rewards models for correctly detecting any single word in phrase. The former is particularly informative for the biomedical domain audience [19].
4. We compare the performance of the CLMs in our experimental setup to the current leader-board performance on extracting PICO elements from the original EBM-NLP dataset [4].
Related Works
Outcome detection
Outcome detection has previously been simultaneously achieved along with Participant and Intervention detection, where researchers aim to classify sentences (extracted from RCT abstracts) into one of P, I and O labels [8, 20, 21]. Despite being restrained by shortage of expertly labeled datasets, few attempts to create EBM-oriented datasets have been made. Bryon et al., [20] use distant supervision to annotate sentences within clinical trial articles with PICO elements. Dina et al., [22] use an experienced Nurse and a medical student to annotate outcomes by identifying and labeling sentences that best summarize the consequence of an intervention. Similarly, other attempts have precisely segmented PubMed abstracts into sentences that they label one of P, I and O [8, 9]. Given the sentence-level annotation adopted in these datasets, it becomes difficult to use them for tasks that require extraction of individual PICO elements [23, 24] such as outcome phrase detection. Nye et al., [4] recently released EBM-NLP corpus that they built using a mixture of crowd workers (non- experts) and expert workers (with the nonexperts being exceedingly more) to annotate individual spans of P, I, O elements within clinical trial articles. This dataset has how- ever been discovered with annotation flaws [10] and uses arbitrary outcome classification labels as discussed in section 2.7. Cognizant of the growing body of research to standardise classifications of outcomes, we are motivated to annotate a dataset with outcome types drawn from a standardised taxonomy.
Transfer Learning (TL)
TL is a machine learning (ML) approach that enables us- age of a model to achieve a task that it was not initially built and trained for [25]. Usually, the assumption is that, train and test data for a specific task exists, however this is never the case, therefore, TL allows learning across different task domains i.e. the term pretrained, implies a model was previously trained on a task different from the current target task. Context-dependent embeddings such as context2vec [26], ELMo [27] and BERT [28] have emerged and outperformed context-independent embeddings [29, 30] in various down- stream NLP tasks.
Bert variants, SciBERT [12] and Clinical BERT [13] yielded performance improvements in the BNER tasks on the BC5DR dataset [16, 31], text-classification tasks like Relation extraction on the ChemProt [32] and on PICO ex- traction. Despite being pre-trained on English biomedical text, BioBERT [11] outperformed generic BERT model (pertained on Spanish biomedical text) in Pharma CoNER, a multi-classification task for detecting mentions of chemical names and drugs from Spanish biomedical text [25]. Recently Qiao et al., [33] discovered that, in comparison to BioBERT, BioELMo (Biomedical ELMo) better clustered entities of the same type such as, an acronym having multiple meanings or a homonym. For example, unlike BioBERT, BioELMo clearly differentiated between ER referring to “Estrogen Receptor” and ER referring to “Emergency Room” in their work.
Materials and Methods
We design two setups in our assessment approach, where
(1) We fine-tune pre-trained biomedical CLMs on the out- come datasets EBM-COMET (introduced in this paper) and EBM-NLP and (2) we augment a neural model to train frozen biomedical embeddings. The aim is to compare the evaluation performance of fine-tuned, frozen biomedical CLM embeddings, generic CLM embeddings and traditional context- independent embeddings such as word2Vec [29] in the out- come detection task defined below.
Outcome Detection Problem (ODP) Task: Given a sentence s of n words, s = w1, . . . , wn within an RCT abstract, outcome detection aims to extract an outcome phrase b = wx, . . . , wd within s, where ≤ 1 ≤ x ≤ d ≤ n. In order to extract outcome phrases such as b, we label each word using “BIO” [34] tags where “B” denotes the first word of the out- come phrase, “I” denotes inside the outcome phrase and “O” denotes all non-outcome phrase words.
Data
EBM-COMET
EBM-COMET is prepared to facilitate outcome detection in EBM. Our annotation scheme adopts a widely acknowledged outcome definition of “a measurement or an observation used to capture and assess the effect of treatment such as assessment of side effects (risk) or effectiveness (benefits)” [35].
Previous EBM dataset construction efforts have lacked a standard classification system to accurately inform their anno- tation process and instead opted for arbitrary labels such as those terms aligned to MeSH [4]. We however leverage an outcome taxonomy recently developed to standardise out- come reporting in electronic databases [2]. The taxonomy authors iteratively reviewed how core outcome sets (COS) studies within the Core Outcome Measures in Effectiveness Trials (COMET) database categorised their outcomes. This review culminated into taxonomy of 38 outcome domains hierarchically classified into 5 outcome types/core areas.
Data collection
Using the Entrez API [36], we automatically fetch 300 abstracts from open access PubMed. Our search criteria only retrieve articles of type “Randomised controlled Trial”. We relied on two domain-experts to review these abstracts and eliminate those reporting outcomes in animals (or non- humans). Each eliminated abstract was replaced by another reporting human outcomes from PubMed.
Annotation
The two experts we work with have sufficient experience in reviewing human health outcomes in clinical trials. Some of their work pertaining to outcomes in clinical trials includes [35, 37- 39]. These experts jointly annotate granular outcomes within the gathered abstracts resulting into EBM- COMET using guidelines below. We are aware of annotation tools such as BRAT [40], however because of the nature of the annotations i.e. some with contiguous outcome spans, the experts prefer to directly annotate them in Microsoft text documents.
Annotation guidelines
The annotators are tasked to identify and verify outcome spans and then assign each an outcome domain referenced from the taxonomy partially presented in Table 1 and full presented in Appendix C. The annotators are instructed to assign each span all relevant outcome domains.
| Core area | Outcome domain | Domain Symbol |
|---|---|---|
| Physiological/Clinical | Physiological/Clinical | P 0 |
| Death | Mortality/survival | P 1 |
| Life Impact | Physical functioning Social functioning Role functioning Emotional function ing/wellbeing Cognitive functioning Global quality of life Perceived health status Delivery of care Personal circumstances |
P 25 P 26 P 27 P 28 P 29 P 30 P 31 P 32 P 33 |
| Resource use | Economic Hospital Need for further intervention Societal/career burden |
P 34 P 35 P 36 P 37 |
| Adverse events | Adverse events/effects | P 38 |
Table 1: A partial version of the taxonomy of outcome classifications developed and used by [1] to classify clinical outcomes extracted from biomedical articles published in COMET, Cochrane re- views and clinical trial registry (Full taxonomy in Appendix C).
Annotation heuristics
For annotation purposes, we firstly assign a unique symbol to each outcome domain (domain symbol column in Table 1). The annotators are then instructed to use these symbols to label the outcome spans they identify. Annotation using these symbols rather than the long domain names is less tedious. Furthermore, we instruct annotators to use xml tags to demarcate the spans, such that an identified span is enclosed within an opening tag with the assigned domain symbol and a closing tag. We refer to easily identifiable outcome spans as simple annotations, and the more difficult ones requiring more demarcation indicators as complex annotations. Figure 1 show examples of the annotations described below,

Figure 1: Research flowchart (“A” represents the connection points).
1. Simple annotations
(a) <P XX> . . . </>: Indicates an outcome belongs to domain XX (where XX can be located in the taxonomy 1).
(b) <P XX, YY> . . . </>: Indicates an outcome be- longs to both domain XX and YY.
2. Complex annotations
Some spans are contiguous in such a way that, they share a word or words with other spans. For example, two out- comes can easily be annotated as a single outcome be- cause they are conjoined by a dependency word or punctuation such as “and”, “or” and commas. We are how- ever fully aware, that this contiguity previously resulted
In multiple outcomes annotated as a single outcome in previous datasets [10]. Therefore, annotators are asked to distinctively annotate them as below,
(a) Contiguous spans sharing bordering term/s appear- ing at the start of an outcome span should be anno- tated as follows,
<P XX>(S#) . . . <P XX> . . . </>: which indicates that, two outcomes are belonging to domain XX that share # of words at the start of the annotated outcome span.
(b) Contiguous spans sharing bordering term/s appear- ing at the end of an outcome span, should be anno- tated as follows,
<P XX> (E#) . . . <P XX>. . . </>: The opposite of the notation above indicating that, two outcomes are belonging to domain XX that share # of words at the end of the annotated outcome span.
Annotation consistency and quality
In the last phase of the annotation process, the annotations are extracted into a structured format (excel sheet) for the annotators to review them, make necessary alterations based on their expertise judgment as well as handle minor errors (such as wrong opening or closing braces) that result from the manual annotation processes. We do not report inter-annotator agreement because the two annotators did not conduct the process independently, but rather jointly. Having previously worked together on similar annotation tasks, they hardly dis- agreed but whenever either was uncertain or disagreed, they discussed between themselves and concluded.
The word, outcome phrase distribution and other statistics of the EBM-COMET are summarized in table 2 with the experimental dataset statistics.
| EBM-COMET | EBM-NLPREV | |
|---|---|---|
| # Of sentences | 5193 | 40092 |
| # Of train/dev/test Sentences |
3895 / 779 / 519 | 30069 / 6014 / 4009 |
| # Of outcome labels | 5 | 6 |
| # Of sentences with Outcome phrases in train/dev/test |
1569 / 451 / 221 | 12481 / 4116 / 3257 |
| Avg # of tokens per Train/dev/test sentence |
20.6 / 21.5 / 21.2 | 25.5 / 26.4 / 25.6 |
| Avg # of outcome Phrases per sentence in train/dev/test |
0.69 / 0.78 / 0.71 | 0.44 / 0.38 / 0.45 |
Table 2: Statistics summary of experimental datasets splits. Figures pertaining to Train, Dev. and Test sets are separated by a forward slash accordingly.
EBM-NLPrev
This dataset is a revision of the original hierarchical label’s version of EBM-NLP dataset [4]. In the hierarchical labels version, the annotated outcome spans were assigned specific labels that include Physical, Pain, Mental, Mortality and Ad- verse effects. Abaho et al., [10] built EBM-NLPrev using a semi-automatic approach that involved POS-tagging and rule-based chunking to correct flaws discovered (by domain- experts) in EBM-NLP. In the evaluation of this revision, classification of outcomes resulted in a significant increase in the F1-score (for all labels) from what it was when using the original EBM-NLP. Some of the major flaws they corrected include,
• Statistical metrics and measurement tools annotated as part of clinical outcomes e.g. “mean arterial blood- pressure” instead of “arterial blood-pressure”, “Quality of life Questionnaire” instead of “Quality of life”, “Work-related stress scores” instead of “Work-related stress”.
• Multiple outcomes annotated as a single outcome e.g. “cardiovascular events-(myocardial infarction, stroke and cardiovascular death)” instead of “myocardial infarction”, “stroke”, and “cardiovascular death”.
• Inaccurate outcome type annotations e.g., “Nausea and Vomiting” labeled as a Mortality outcome instead of a Physical outcome.
• Combining annotations in non-human studies with those in human-studies particularly studies reporting out- comes in treating beef cattle.
Biomedical contextual language models
We leverage the datasets to investigate the ODP task performance of 6 different biomedical CLMs (Table 3) derived from 3 main architectures. 1) BERT [28], a CLM built by learning deep bidirectional representations of input words by jointly incorporating left and right context in all its layers. It works by masking a portion of the input words and thereby predicting missing words in each sentence. BERT encodes a word by incorporating information about words around it within a given input sentence using a self-attention mechanism [41] 2) ELMo [33] is a CLM that learns deep bidirectional representations of input words by jointly maximizing the probability of forward and backward directions in a sentence, and 3) FLAIR [42], a character-level bidirectional LM which learns representations of each character by incorporating character information around it within a sequence of words.
| Model | Biomedical Variant | Pre-trained on |
| Bert | BioBERT [1] | 4.5B words from PubMed abstracts + 13.5B words from PubMed Central (PMC) articles. |
| SciBERT [2] | 1.14M Semantic scholar papers [3] (18% From Computer science and 82% from biomedical domains). |
|
| ClinicalBERT [4] | 2 million notes in the MIMIC-III v1.4 database [5] (hospital care data recorded by nurses). (Bio+ClinicalBERT BERT is BioBERT pre-trained on the above notes) |
|
| DischargeSumm aryBERT [4] | Similar to ClinicalBERT but only discharge summaries are used (Bio+DischargeSummary BERT is BioBERT pre-trained on the summaries) | |
| ELMo | BioELMo [6] | 10M PubMed abstracts (ca. 2.64B tokens) |
| FLAIR | Bio FLAIR [7] | 1.8m PubMed abstracts |
Table 3: A catalogue of CLMs used for the outcome detection task
We begin by further training the pre-trained CLMs in Table 3 in a fine-tuning approach [43], where the CLMs learn to (1) encode each word wi into a hidden state hi and (2) predict the correct label given hi. Similar to Sun et al. [25], we introduce a non-linear softmax layer to predict a label for each hi corresponding to word wi, as shown in Figure 2, where hi = CLM (wi), (BERT-variants, BioELMo, Bio FLAIR)∈ CLM. (see Appendix A.1 (Fine-tuning) for more details).

Figure 2: BNER for token-level outcome phrase detection, for two setups, left: Fine-tuning and right Feature extraction using ODPtagger.
ODP-tagger
We build ODP-tagger to not only assess context- independent (W2V) representations, but also assess the performance of frozen context-dependent representations for the ODP task. Demonstrated by the dotted line from Fine-tuning to input tokens in Figure 2, is a feature extraction [44] approach, where the tagger’s embedding layer takes as input, a sequence of tokens (sentence) and a sequence of POS terms corresponding to the tokens. We add a POS feature for each token to enrich the model in a manner similar to how prior neural classifiers are enhanced with character and n-gram features [45]. Each word/token is therefore represented by concatenating either a pre-trained CLM or a W2V embedding w and a randomly initialised embedding for the corresponding POS term p. The token embeddings are then encoded to obtain hidden-states for each sequence position,
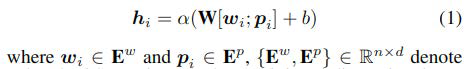
Word and POS matrices each containing d-dimensional embeddings for n words and n corresponding POS terms, wi and pi are the word and POS embeddings representing the ith word and its POS term, ; implies a concatenation opera- tion and then α is a linear activation function that generates hidden states for the input words. We then use a condition random field (CRF) layer for classification given the hidden state hi. A CRF is an undirected graphical model which de- fines a conditional probability distribution over possible labels [46].
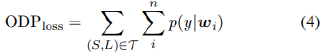
All the models are each trained to maximize the probability of the labels given each word wi ∈ s.
where β is a scaling factor that empirically sets each labels
weights to be inversely proportional to the label frequency I.e. β
=  and Ny is the number of training samples with ground-truth
label y. T is the training set containing sentences, wi ∈ S and y
∈ L.
and Ny is the number of training samples with ground-truth
label y. T is the training set containing sentences, wi ∈ S and y
∈ L.
Training
All models are evaluated on the two datasets discussed in section 3.1. These datasets are each partitioned as follows, 75% for training (train), 15% for development (dev.) and 10% for testing (test). We leverage the large size of EBM-NLP and use its dev. set to tune hyper parameters for the ODP-tagger and finetuned models (Parameter settings in Appendix B). Each model is trained on a train split of a particular dataset and evaluated on the corresponding test split culminating into results shown in Table 5. We use a simple powerful NLP python framework called flair2 to extract word embeddings from all the BERT and FLAIR variants, and AllenAI3 for BioELMo. Dimensions of the extracted Bio FLAIR and BioELMo embeddings are very large, i.e. 7672 and 3072 respectively, which would most likely over whelm our memory and power-constrained devices during training. Therefore, we apply Principal component Analysis (PCA) dimensionality reduction technique to reduce their dimensions to half their original sizes while preserving se- mantic information [47]. Alongside these embeddings, we evaluate context-independent embeddings which we obtain by training word2vec (W2V) embedding algorithm [29] on 5.5B tokens of PubMed and PMC abstracts. Python and Pytorch [48] deep learning framework are used for implementation, which together with the datasets are made publicly available here https://github. com/MichealAbaho/ODP-tagger.
Evaluation results
Results shown in Table 4 firstly reveal the superiority of finetuning the CLMs in comparison to the ODP-tagger. The best performance across both set-ups is obtained when BioBERT is fine-tuned on the EBM-COMET dataset. How- ever, we observe SciBERT outperform it in the ODP-tagger
Set-up on the EBM-COMET dataset Secondly, we observe context-independent (W2V) embeddings produce competitive performance on EBM-NLPrev but significantly lower performance on EBM-COMET. Bio FLAIR and Clinical BERT were the least performing models, which for Bio FLAIR, we attributed to (1) it is originally trained on a relatively smaller corpus of PubMed+PMC abstracts than the other high performing BERT variants, (2) downsizing its embeddings us- ing PCA dimensionality reduction. For Clinical BERT, we attributed its struggles to the nature of the corpora on which it is trained which include clinical notes associated with patient hospital admissions [49] rather than clinical trial abstracts which more often report outcomes. An additional in- sight we drew was, performance on the EBM-NLPrev dataset is lower compared to that achieved on EBM-COMET. This was attributed to the annotation inconsistencies in the original EBM-NLP, some of which were resolved in [10]. Another aspect we closely observed was the runtime. Using a TITAN RTX 24GB GPU, the average runtime for the fine-tuning experiments on EBM-COMET and EBM-NLPrev respectively was 7 and 12 hrs. On the other-hand, feature extraction (ODP-tagger) experiments were much longer consuming 20 and 36 hours respectively on the same datasets. Overall, we recommend fine-tuning as a preferred approach for outcome detection, more saw using BioBERT and SciBERT as ideal embedding models.
Full outcome phrase detection
To preserve the quality of extracted outcome phrases, we investigate how well the best performing models (BioBERT fine-tuned on EBM-COMET and BioBERT fine-tuned on EBMNLPrev from Table 4) can detect full mention of out- come phrases. Accurate fine-grained information is beneficial in the medical domain [50]. We use a strict criteria to evaluate full mention of outcomes, where a classification error FN (False Negative) accounts for the number of full outcome phrases the model fails to detect, which includes partially correctly detected phrases i.e. some of their tokens were misclassified.
Fine-tuning |
Feature extraction | ||||
|---|---|---|---|---|---|
| Model | EBM-NLPrev | EBM-COMET | Model | EBM-NLPrev | EBM-COMET |
| W2V | - | - | ODP-tagger + W2V | 44.0 | 59.3 |
| BERT | 51.8 | 75.5 | +BERT | 43.2 | 64.2 |
| ELMO | 49.6 | 71.4 | +ELMO | 43.0 | 61.2 |
| BioBERT | 53.1 | 81.5 | +BioBERT | 48.5 | 69.3 |
| BioELMo | 52.0 | 75.0 | +BioELMo | 46.5 | 62.9 |
| Bio FLAIR | 51.4 | 76.7 | +Bio FLAIR | 40.7 | 60.5 |
| SciBERT | 52.8 | 77.6 | +SciBERT | 48.1 | 70.4 |
| ClinicalBERT | 51.0 | 68.5 | +ClinicalBERT | 45.2 | 65.7 |
| Bio+ClinicalBERT | 51.0 | 68.3 | +Bio+ClinicalBERT | 45.8 | 66.3 |
| Bio+Disc Summary BERT | 51.0 | 70.0 | +Bio+Disc Summary | 46.1 | 68.4 |
Table 4: Macro-average F1 scores obtained from generic CLMs and their respective In-domain (biomedical) versions for both fine-tuning and ODP-tagger (feature extraction) for token-level detection of outcome phrases from both datasets.
In Table 5, we show examples of outputs of both models for the ODP task given an input sentence with known actual outcome phrases (underlined). Fine-tuned model correctly detects (bluecoded) all full out- come phrase in the first example sentence i.e. Precision (P), Recall/Sensitivity (R) are 100%, whereas tagger only detects 3/4 outcomes, hence P is 100%, R is 75%. Neither of the models correctly captures full mention of the outcome phrase in the second example; they incorrectly predict some words (red-coded) to not belong to the outcome phrase. While traditionally, results of fine-tuned model would be a P of 100% and R of 50% for correct prediction of 2/4 tokens, in our strict full name evaluation, P and R, are 0%, because some tokens in the full outcome phrase are misclassified in both models I.e. True positives = 0. Similarly, in the third example, fine- tuned model achieves P of 100% and R of 60% for correct prediction of 3/5 tokens in the traditional evaluation, whereas for the strict full name evaluation, R is 50% because only 1/2 full outcome phrases are detected. We attribute these errors to the length of some outcome phrases with some containing extremely common words such as prepositions (“of”). Additionally, we note that the contiguous outcome span annotations (containing several outcomes sharing terms e.g. “right heart size and function” in the third example) are rare.
Method |
Abstract sentence | Full outcome phrase | ||
|---|---|---|---|---|
| Input sentence | Among patients who received sorafenib, the most frequently reported adverse eventswere grade 1 or 2 events of rash (73%), fatigue(67%), hypertension(55%) and diarrhea(51%). | Adverse events
|
|
|
| EBM-COMET ODP- target+ SciBERT +EMB-COMET |
Output | Among patients who received sorafenib, the most frequently reported adverse eventswere grade 1 or 2 events of rash (73%), fatigue(67%), hypertension(55%) and diarrhea(51%). | Adverse events
|
|
| Output | Among patients who received sorafenib, the most frequently reported adverse eventswere grade 1 or 2 events of rash (73%), fatigue(67%), hypertension(55%) and diarrhea(51%). | Fatigue
|
|
|
| BioBERT+ EBM-COMET ODP- target+ Sci BERT +EMB-COMET |
Input sentence | The average duration of operating procedure was 1 hour and 35 minutes | - Duration of operating procedure | |
| Output | The average duration of operating procedure was 1 hour and 35 minutes. | |||
| Output | The average duration of operating procedure was 1 hour and 35 minutes. | |||
| Input sentence | The objective of this study was to evaluate right heart sizeand functionassessed by echocardiography during long term treatment with riociguat | Right heart size right heart function | ||
| BioBERT+ EBM-COMET | Output | The objective of this study was to evaluate right heart size and function assessed by echocardiography during long term treatment with riociguat |
|
|
| ODP- target+ SciBERT +EMB-COMET | Output | The objective of this study was to evaluate right heart size and function assessed by echocardiography during long term treatment with riociguat | ||
Table 5: Right heart size and function assessed by echocardiography during long term treatment with riociguat.
In Table 6, we observe the F1 of the best models drop from 53.1 to 52.4 for EBM-NLPrev and 81.5 to 69.6 for EBM-COMET. This implies that the model struggles to identify full outcome phrases, especially with the EBM-NLPrev dataset. Specificity on the other hand is very high for both datasets simply because it is calculated as a True Negative Rate (TNR), in which case True Negatives (non-outcomes) are certainly so many because they are precisely individual words and therefore are counted word by word as opposed to True positives (actual outcome phrases) that can consist of multiple words. We further investigate the errors from the best performing models BioBERT+EBM-COMET (Fine-tuned) and ODP-tagger+SciBERT+EBM-COMET.
| P | R | S | F | |
|---|---|---|---|---|
| EBM-NLPrev | 53.7 | 51.2 | 99.2 | 52.4 |
| EBM-COMET | 60.8 | 81.3 | 98.0 | 69.6 |
Table 6: Precision (P), Recall/Sensitivity (R), Specificity (S) and F1 of outcome entities in EBM-NLPrev and EBM-COMET.
Evaluation on the original EBM-NLP
We additionally fine-tune our best model for the task of detection of all PIO elements in the original EBM-NLP dataset. To be consistent with the original EBM-NLP paper, we con- sider the token-level detection of the PIO elements task in their work, comparing their evaluation results for hierarchical labels with those we obtain by fine-tuning our best model. Using their published training (4670) and test (190) sets of the starting spans, we see fine-tuned BioBERT model outperform the current leader board results 4 and the SOTA results published by Brockmeier et al [24] (Table 7).
| P | I | O | |
|---|---|---|---|
| Logreg | 45.0 | 25.0 | 38.0 |
| Lstm-crf | 40.0 | 50.0 | 48.0 |
| Brockmeier et.al [1] | 70.0 | 56.0 | 70.0 |
| Fine-tuned BioBERT | 71.6 | 69.0 | 73.1 |
| Fine-tuned BioBERT – Full | 61.6 | 64.0 | 53.1 |
Table 7: F1 scores of token level detection of PIO elements reported for EBM-NLP hierarchical labels dataset by the EBM-NLP [4] leader board.
| EBM-NLPrev (F1%) | |
|---|---|
| BiLSTM-spaCY-MedPOST | 80.5 |
| BiLSTM-Stanford-MedPOST | 81.3 |
| BiLSTM-Genia-Tagger | 79.0 |
Table 8: Sentence classification results on EBM-NLP corpus from BiLSTM model consuming words and parts of speech (POS) assigned by clinically induced POS taggers.
| EBM-NLPrev | |
|---|---|
| BiLSTM | 0.27 |
| BiLSTM + IIL1 | 0.37 |
| BiLSTM + IIL2 | 0.38 |
| BiLSTM+ CB | 0.37 |
| BiLSTM + FL | 0.19 |
Table 9: ODP task results for various cost-sensitive functions on the EBM-NLP corpus using a BiLSTM.
Model |
F1 % |
|---|---|
| • BiLSTM | 32.5 |
| • BiLSTM + POS | 37.9 |
| • BiLSTM + POS + W2V | 41.1 |
| • BiLSTM + POS + W2V + IIL | 43.2 |
| • BiLSTM + POS + W2V + IIL+ US50 | 43.6 |
| • BiLSTM + POS + W2V + IIL+ US50 + CRF | 44.0 |
Table: 10: BiLSTM
Fine-tuning |
||
|---|---|---|
| Tuned range | Optimal | |
| Learning rate | [1e-5,1e-4, 1e-3, 1e-2] | 1e-5 |
| Train Batch size | [16, 32] | 32 |
| Epochs | [3, 5, 10] | 10 |
| Sampling % (US) | [50, 75, 100] | 100 |
| Optimizer | [Adam, SGD] | Adam |
| ODP-tagger | ||
| Learning rate | [1e-4, 1e-3, 1e-2, 1e-1] | 1e-1 |
| Train Batch size | [50, 150, 250, 300] | 300 |
| Epochs | [60, 80, 120, 150] | 60 |
| Sampling % (US) | [10, 25, 50, 75] | 50 |
| Optimizer | [Adam, SGD] | SGD |
Table 11: Hyper-parameter tuning details in the feature extraction approach for the fine-tuned CLMs and the ODP-tagger (feature extraction).
| Core area | Outcome domain | Domain symbol | Explanation |
|---|---|---|---|
| Physiological | Physiological/Clinical | P 0 | Includes measures of physiological function, signs and symptoms, laboratory (and other scientific) measures relating to physiology. |
| Death | Mortality/survival | P 1 | Includes overall (all-cause) survival/mortality and cause-specific survival/mortality, as well as composite survival outcomes that include death (e.g. disease-free survival, progression-free survival, amputation-free survival). |
| Life impact | Physical functioning | P 25 | Impact of disease/condition on physical activities of daily living (for example, ability to walk, independence, self-care, performance status, disability index, motor skills, sexual dysfunction. health behaviour and management). |
| Social functioning | P 26 | Impact of disease/condition on social functioning (e.g. ability to socialise, behaviour within society, communication, companionship, psychosocial development, aggression, recidivism, participation) | |
| Role functioning | P 27 | Impact of disease/condition on role (e.g. ability to care for children, work status). |
|
| Emotional functioning/wellbeing | P 28 | Impact of disease/condition on emotions or overall wellbeing (e.g. ability to cope, worry, frustration, confidence, perceptions regarding body image and appearance, psychological status, stigma, life satisfaction, meaning and purpose, positive affect, self-esteem, self-perception and self-efficacy). | |
| Cognitive functioning | P 29 | Impact of disease/condition on cognitive function (e.g. memory lapse, lack of concentration, attention); outcomes relating to knowledge, attitudes and beliefs (e.g. learning and applying knowledge, spiritual beliefs, health beliefs/knowledge). | |
| Global quality of life | P 30 | Includes only implicit composite outcomes measuring global quality of life | |
| Perceived health status | P 31 | Subjective ratings by the affected individual of their relative level of health. Includes outcomes relating to the delivery of care, including - adherence/compliance, withdrawal from intervention e.g. time to treatment failure). - Tolerability/acceptability of intervention. - Appropriateness, accessibility, quality and adequacy of intervention. - Patient preference, patient/career satisfaction (emotional rather than financial burden). - Process, implementation and service outcomes (e.g. overall health system performance and the impact of service provision on the users of services). | |
| Personal circumstances | P 33 | Includes outcomes relating to patient’s finances, home and environment. | |
| Resource use | Economic | P 34 | Includes general outcomes (e.g. cost, resource use) not captured within other specific resource use domains |
| Hospital | P 35 | Includes outcomes relating to inpatient or day care hospital care (e.g. duration of hospital stays, admission to ICU). | |
| Need for further intervention | P 36 | Includes outcomes relating to, - medication (e.g. concomitant medications, pain relief) - surgery (e.g. caesarean delivery, time to transplantation) - other procedures (e.g. dialysis-free survival, mode of delivery) | |
| Societal/carer burden | P 37 | Includes outcomes relating to financial or time implications on career or society as a whole e.g. need for home help, entry to institutional care, effect on family income | |
| Adverse events | Adverse events/effects | P 38 | Includes outcomes broadly labeled as some form of unintended consequence of the intervention e.g. adverse events/effects, adverse reactions, safety, harm, negative effects, toxicity, complications, sequelae. Specifically named adverse events should be classified within the appropriate taxonomy domain above |
Table 12: Taxonomy of outcome classifications developed and used by [2] to classify clinical outcomes extracted from biomedical articles published in repositories that include Core Outcome Measures in Effectiveness Trials (COMET), Cochrane reviews and clinical trial registry.
Outcome phrase length
To further understand our results, we investigated how well the best models BioBERT+EBM-COMET (Fine-tuned) and ODPtagger+ SciBERT+EBM-COMET (Feature-extraction) detected outcome phrases of varying lengths. We calculate prediction accuracy as number of correctly predicted outcome-phrases of length x/number of all outcome-phrases of length x, where x ranged from 1-10. As observed in 3, the fine-tuned model slightly outperforms the ODP-tagger especially for outcome phrases having 3-6 words (i.e. 3-6 entity span length). However, it is also clear that both models struggled to accurately detect outcome phrases containing 7 or more words (Figure 3).

Figure 3: BNER for token-level outcome phrase detection, for two setups, left: Fine-tuning and right Feature extraction using ODPtagger.
Conclusion
In this work, we present EBM-COMET, a dataset of clinical trial abstracts with outcome annotations to facilitate EBM tasks. Experiments showed that CLMs perform much better on EBMCOMET than they do on EBM-NLP, indicating it is suited for ODP task especially because it is well aligned to standardised outcome classifications. Our assessment showed fine-tuned models consistently outperform and converge faster than feature extraction, particularly pre- trained BioBERT and SciBERT embedding models. Additionally, we show the significance of accurate detection of full mention of granular outcome phrases which is beneficial for clinicians searching for this information.
REFERENCES
- Bartlett VL, Dhruva SS, Shah ND, et al. Feasibility of Using Real-World Data to Replicate Clinical Trial Evidence. JAMA Network Open. 2019; 2(10):e1912869-e1912869.
- Dodd S, Clarke M, Becker L, et al. Taxonomy has been developed for outcomes in medical research to help improve knowledge discovery. J Clin Epid. 2018 4; 96: 84-92.
- Sackett DL, Rosenberg WMC, Gray JAM, Haynes RB, Richardson WS. Evidence based medicine: what it is and what it isn’t. BMJ. 1996; 312(7023): 71-72.
- Nye B, Li JJ, Patel R, Yang Y, Marshall IJ, Nenkova A, et al. A corpus with multi-level annotations of patients, interventions and outcomes to support language processing for medical literature. In: Proceedings of the conference. Ass for Com Ling. Meeting. 2018: 197.
- Coiera E, Choong MK, Tsafnat G, Hibbert P, Runciman WB. Linking quality indicators to clinical trials: an automated approach. Int J for Qlty in Hlth Care. 2017; 29(4): 571-578.
- Demner-Fushman D, Lin J. Answering clinical questions with knowledge-based and statistical techniques. Comp Linguistics. 2007; 33(1):63-103.
- Huang X, Lin J, Demner-Fushman D. Evaluation of PICO as a knowledge representation for clinical questions. AMIA Annual Symposium proceedings AMIA Symposium. 2006:359-363.
- Jin D, Szolovits P. Pico element detection in medical text via long short-term memory neural networks. In: Proceedings of the BioNLP 2018 workshop. 2018: 67–75.
- Kim SN, Martinez D, Cavedon L, Yencken L. Automatic classification of sentences to support evidence based medicine. In: BMC bioinformatics. BioMed Central. 2011; 12: 1-10.
- Abaho M, Bollegala D, Williamson P, Dodd S. Correcting crowdsourced annotations to improve detection of outcome types in evidence based medicine. In: CEUR Workshop Proceedings. 2019; 2429: 1-5.
- Lee J, Yoon W, Kim S, Kim D, Kim S, So CH, et al. BioBERT: a pre-trained biomedical language representation model for biomedical text mining. Bioinformatics. 2020; 36(4): 1234- 1240.
- Beltagy I, Lo K, Cohan A. SciBERT: A Pertrained language model for scientific text. ArXiv preprint arXiv: 190310676. 2019.
- Alsentzer E, Murphy JR, Boag W, Weng WH, Jin D, Naumann T, et al. Publicly available clinical BERT embeddings. ArXiv preprint arXiv: 190403323. 2019.
- Stubbs A, Kotfila C, Uzuner Automated systems for the de- identification of longitudinal clinical narratives: Overview of 2014 i2b2/UTHealth shared task Track 1. J biomed info. 2015; 58: S11-S19.
- Uzuner Luo Y, Szolovits P. Evaluating the state of the art in automatic de-identification [Journal Article]. J Ame Med Info Assn. 2007; 14(5):550–563.
- Li J, Sun Y, Johnson RJ, Sciaky D, Wei CH, Leaman R, et al. Bio Creative V CDR task corpus: a resource for chemical disease relation extraction. Database. 2016.
- Biggane AM, Brading L, Ravaud P, Young B, Williamson PR. Survey indicated that core outcome set development is increasingly including patients, being conducted internationally and using Delphi surveys. 2018; 19(1): 1-6.
- Mascio A, Kraljevic Z, Bean D, Dobson R, Stewart R, Bendayan R, et al. Comparative Analysis of Text Classification Approaches in Electronic Health Records. ArXiv preprint arXiv: 200506624. 2020.
- Leaman R, Wei CH, Lu Z. tmChem: a high performance approach for chemical named entity recognition and normalization [Journal Article]. J chem info. 2015; 7(S1): S3.
- Wallace BC, Kuiper J, Sharma A, Zhu M, Marshall IJ. Extracting PICO sentences from clinical trial reports using supervised distant supervision. J Mach Lrng Res. 2016; 17(1): 4572-4596.
- Kiritchenko S, De Bruijn B, Carini S, Martin J, Sim I. ExaCT: automatic extraction of clinical trial characteristics from journal publications. BMC med info and deci mak. 2010; 10(1): 56.
- Demner-Fushman D, Few B, Hauser SE, Thoma G. Automatically identifying health outcome information in MEDLINE records [Journal Article]. J Ame Med Info Assn. 2006; 13(1):52-60.
- Kang T, Zou S, Weng C. Pretraining to Recognize PICO Elements from Randomized Controlled Trial Literature. Stud in hlth tech and info. 2019; 264: 188.
- Brockmeier AJ, Ju M, Przybyła P, Ananiadou S. Improving reference prioritisation with PICO recognition. BMC med info and dcsn mak. 2019; 19(1): 1-14.
- Sun C, Yang Z. Transfer learning in biomedical named entity recognition: An evaluation of BERT in the PharmaCoNER task. In: Proceedings of the 5th Workshop on BioNLP Open Shared Tasks; 2019: 100-104.
- Melamud O, Goldberger J, Dagan I. context2vec: Learning generic context embedding with bidirectional lstm. In: Proceedings of the 20th SIGNLL conference on computational natural language learning. 2016: 51–61.
- Peters ME, Neumann M, Iyyer M, Gardner M, Clark C, Lee K, et al. Deep contextualized word representations. ArXiv preprint arXiv: 180205365. 2018.
- Devlin J, Chang MW, Lee K, Toutanova K. Bert: Pretraining of deep bidirectional transformers for language understanding. ArXiv preprint arXiv: 181004805. 2018.
- Mikolov T, Chen K, Corrado G, Dean J. Efficient estimation of word representations in vector space. ArXiv preprint arXiv: 13013781. 2013.
- Pennington J, Socher R, Manning CD. Glove: Global vectors for word representation. In: Proceedings of the 2014 conference on empirical methods in natural language processing (EMNLP); 2014: 1532-1543.
- Dogan RI, Leaman R, Lu Z. NCBI disease cor- ˘ pus: a resource for disease name recognition and concept normalization. J biomed info. 2014; 47: 1-10.
- Kringelum J, Kjaerulff SK, Brunak S, Lund O, Oprea TI, Taboureau O. ChemProt-3.0: a global chemical biology diseases mapping. Database. 2016.
- Jin Q, Dhingra B, Cohen WW, Lu X. Probing biomedical embeddings from language models. ArXiv preprint arXiv: 190402181. 2019.
- Sang EF, Veenstra J. Representing text chunks. ArXiv preprint cs/9907006. 1999.
- Williamson PR, Altman DG, Bagley H, Barnes KL, Blazeby JM, Brookes ST, et al. The COMET handbook: version 1.0. Trials. 2017; 18(3): 280.
- Sayers E. The E-utilities in-depth: parameters, syntax and more. Entrez Programming Utilities Help. 2009.
- Williamson PR, Altman DG, Blazeby JM, Clarke M, Devane D, Gargon E, et al. Developing core outcome sets for clinical trials: issues to consider. 2012; 13(1): 1-8.
- Kirkham JJ, Dwan KM, Altman DG, Gamble C, Dodd S, Smyth R, et al. The impact of outcome reporting bias in randomised controlled trials on a cohort of systematic reviews. Bmj. 2010; 340.
- Dwan K, Gamble C, Williamson PR, Kirkham JJ. Systematic review of the empirical evidence of study publication bias and outcome reporting bias-an updated review. PloS one. 2013; 8(7): e66844.
- Stenetorp P, Pyysalo S, Topic G, Ohta T, Ananiadou S, ´ Tsujii J. BRAT: a web-based tool for NLP-assisted text annotation. In: Proceedings of the Demonstrations at the 13th Conference of the European Chapter of the Association for Computational Linguistics. 2012: 102-107.
- Vaswani A, Shazeer N, Parmar N, Uszkoreit J, Jones L, Gomez AN, et al. Attention is all you need. ArXiv preprint arXiv: 170603762. 2017.
- Akbik A, Blythe D, Vollgraf R. Contextual string embeddings for sequence labelling. In: Proceedings of the 27th international conference on computational linguistics. 2018: 1638-1649.
- Howard J, Ruder S. Universal language model fine-tuning for text classification. ArXiv preprint arXiv: 180106146. 2018.
- Peters ME, Ruder S, Smith NA. To tune or not to tune? Adapting Pertrained representations to diverse tasks. ArXiv preprint arXiv: 190305987. 2019.
- Liu L, Mu F, Li P, Mu X, Tang J, Ai X, et al. Neural classifier: An open-source neural hierarchical multi-label text classification toolkit. In: Proceedings of the 57th Annual Meeting of the Association for Computational Linguistics: System Demonstrations. 2019: 87-92.
- Lafferty J, McCallum A, Pereira FC. Conditional random fields: Probabilistic models for segmenting and labelling sequence data. 2001.
- Raunak V, Gupta V, Metze F. Effective dimensionality reduction for word embeddings. In: Proceedings of the 4th Workshop on Representation Learning for NLP. 2019: 235-243.
- Paszke A, Gross S, Massa F, Lerer A, Bradbury J, Chanan G, et al. Pytorch: An imperative style, high performance deep learning library. ArXiv preprint arXiv: 191201703. 2019.
- Johnson AE, Pollard TJ, Shen L, Li-Wei HL, Feng M, Ghassemi M, et al. MIMIC-III, a freely accessible critical care database. Scientific data. 2016; 3(1):1-9.
- van Aken B, Papaioannou JM, Mayrdorfer M, Budde K, Gers FA, Loser A. Clinical Outcome Prediction from ¨ Admission Notes using Self-Supervised Knowledge Integration. ArXiv preprint arXiv: 210204110. 2021.
- Manning CD, Surdeanu M, Bauer J, Finkel JR, Bethard S, McClosky D. The Stanford CoreNLP natural language processing toolkit. In: Proceedings of 52nd annual meeting of the association for computational linguistics: system demonstrations: 2014: 55-60.
- Tsuruoka Y, Tateishi Y, Kim JD, Ohta T, McNaught J, Ananiadou S, et al. Developing a robust part-of-speech tagger for biomedical text. In: Panhellenic Conference on Informatics. Springer. 2005: 382-392.
- Kim JD, Ohta T, Tateisi Y, Tsujii J. GENIA corpus—a semantically annotated corpus for biotextmining. Bioinformatics. 2003; 19(suppl 1): i180-i182.
- Smith L, Rindflesch T, Wilbur WJ. MedPost: a part of-speech tagger for biomedical text. Bioinformatics. 2004; 20(14): 2320-2321.
- Wang YX, Ramanan D, Hebert M. Learning to model the tail. In: Proceedings of the 31st International Conference on Neural Information Processing Systems. 2017: 7032-7042.
- Cui Y, Jia M, Lin TY, Song Y, Belongie S. Class balanced loss based on effective number of samples. In: Proceedings of the IEEE/CVF Conference on Computer Vision and Pattern Recognition. 2019: 9268-9277.
- Lin TY, Goyal P, Girshick R, He K, Dollar P. Focal loss ´ for dense object detection. In: Proceedings of the IEEE international conference on computer vision. 2017: 2980- 2988.
- Bewick V, Cheek L, Ball J. Statistics review 9: one-way analysis of variance. Critical care. 2004; 8(2): 1-7.
Appendix
(A) Adapting CLMs to Outcome Detection Task
Fine-tuning
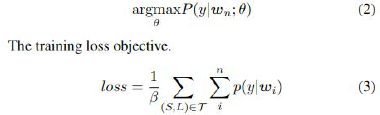
The biomedical CLMs presented under section 3.2 are fine tuned for the Outcome Detection (ODP) task. Given an input sentence containing n words/tokens, e.g. s = w1, . . . , wn, the CLMS are used to encode each a word wi to obtain a hidden state representation hi = CLM(wi), where 1 ≤ i ≤ n, {BERT-variants, BioELMo, Bio FLAIR}∈ CLM and hi ∈ Rn × d (i.e. hi is a vector of size d). We then apply softmax function to return a probability of each label for each position in the sentence s, y = softmax (W · hi + b), where W ∈ R|L|×k i.e. W is a matrix with dimensions |L| (size of label set) ×k (hidden-state size). L represents the set of outcome type target labels. Given the probability distribution the softmax generates at each position, we use argmaxθ P (y|wn; θ) to return the predicted outcome type label.
Building an outcome detection model (ODP-tagger)
In this work, we augment a BiLSTM model with in-domain resources including medically oriented part-of-speech tags (POS) and PubMed word2vec vectors [29]. W e t hen t rain t he model o n E BM-NLPrev incorporating a class distribution balancing factor which essentially aims to regularize the multi way softmax loss with a balanced weighting across multiple classes. The conscious effort of augmenting a regular BiLSTM was indeed re-enumerated with a visible gradual improvement in dev set F1 scores for the ODP task as Table 10 presents. Below sections cover the augmentation steps.
Custom trained biomedical POS
We compare the performance of 3 Part-Of-Speech (POS) taggers, which include, 2 popular generic and fully established Natural language Processing (NLP) libraries, spaCy5 [1], Stanford Core NLP6 [51], and a tagger specifically tuned for POS tagging tasks on biomedical text (Genia-Tagger) [52]. The Genia-Tagger is pre-trained on a collection of articles extracted from the MEDLINE database [53]. To avoid any biased analysis in the comparative study, spaCy and Stanford Core NLP are also customized for biomedical text by training them on a corpus of 6,700 Medline sentences (MedPOST) annotated with 60 POS tags [54]. These 3 taggers are evaluated on a sentence classification task, in which we use a BiLSTM model and a softmax classification layer to classify outcome phrases from the EBM-NLPrev dataset. The model using trained Stanford tagger outperforms the other two models (Table 8), and as a result, we use Stanford Core NLP for POS tagging in the proceeding ODP task.
Context-Independent PubMed word2vec vectors (W2V)
We train word2vec (W2V) on 5.5B tokens of PubMed and PMC abstracts to obtain these vectors. These fixed vectors are later replaced by the pre-trained CLMs in the feature extraction approach during evaluation.
Probing for a loss function for the ODP-tagger
We assess 3 cost-sensitive functions premised on a log likelihood objective log p (y|w), (log probability of label y given input word w) to identify a suitable learning loss for the ODP-tagger experiments.
Where T is the training set containing sentences, wi ∈ S and y ∈ L.
Imputed Inverse loss (IIL) function.
Empirically setting each label’s weights to be inversely proportional to the label frequency a relatively simple heuristic that has been widely adopted [55]
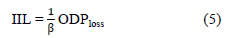
We check two variants of the scaling factor β in the Imputed Inverse Loss equation IIL1,  and a smoothed
version IIL2, where Ny is the number of training samples labelled y or frequency of ground truth label y.
and a smoothed
version IIL2, where Ny is the number of training samples labelled y or frequency of ground truth label y.
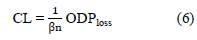
Class balanced loss (CB)
The Class balanced loss proposed by Cui et al., [56] discusses the concept of effective number of samples to capture the diminishing marginal benefits of incrementing the samples of a class. Due to the intrinsic similarities among real-world data, increasing the sample size of a class might not necessarily improve model-performance. Cui et al., [56] introduces a weighting factor that is inversely proportional to the effective number samples En.
Where 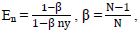 N is dataset size and ny is the sample size of label y,
Focal loss (FL)
Focal loss assigns higher weights to harder examples and lowers ones to the easier examples [57]. It introduces a scaling factor (1 − p) λ . λ is a focusing parameter in the loss function which decays to zero as the confidence in the correct class increases hence automatically down weighting the contribution of easy examples in the training and rapidly focusing on harder examples.

Where α is a weighting factor, α ∈ (0, 1), αy is set to  , Ny is the number of training samples for class y, Py is the
probability of ground truth label y. We do not hypertune the focusing parameter λ, and instead set it to λ = 2 based
on having achieved good results in examples [57].
, Ny is the number of training samples for class y, Py is the
probability of ground truth label y. We do not hypertune the focusing parameter λ, and instead set it to λ = 2 based
on having achieved good results in examples [57].
Results in table 9 indicate both IIL variants and CB are quite competitive, however we chose IIL2 particularly because it slightly outperforms all the other tested IIL2 for the objective loss function.
Introducing an under sampling hyper-parameter (US)
In this strategy, we randomly under sample the majority class of the dataset by a specified percentage. The objective of the ODP-tagger is to minimize the Imputed Inverse loss (IIL) derived from the negative log likelihood loss when predicting labels,
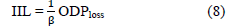
Table 10 results are emblematic of the positive impact each of the different strategies had in architecting the ODPtagger. We observe slight performance improvements upon adopting US50 (a strategy in which the majority class is under sampled by 50% during training) and replacement of the softmax with a CRF for classification. We check for the statistical significance of these improvements using a One-way ANOVA test [58] between the means of two groups of F1-scores, i.e. (1) F1-scores from 1 to 4 (without US50) and (2) F1-score 5 (with US50). Results obtained (p = 0.41, significance level α = 0.05, p > 0.05) indicate that there is no statistically significant difference between the groups, hence implying that the improvement US50 brings about isn’t statistically significant. The same test is repeated changing group (2) to F1- score 6 (with CRF), and this still arrives to no statistically significant difference (p = 0.38, p > 0.05). Despite the improvements of both US50 and CRF being statistically insignificant, we proceed with the best performing parametric configurations for the ODP-tagger to achieve the ODP task. Table 10: ODP task results for various cost-sensitive functions on the EBM-NLP corpus using a BiLSTM.
B Hyper-parameter Tuning
The tuned ranges for the hyper-parameters used in our models are included in Table 11.
C A classification taxonomy of outcome domains suitable for retrieval of outcome phrases from clinical text (Show in Table 12.)